
What Black Friday 2025 taught us (and what to watch in 2026)
Black Friday 2025 broke records, but app downloads and engagement diverged. See what the data says and how to test smarter in 2026.

October 20, 2026
What actually happened during last year's record-breaking Thanksgiving weekend—and what should you do differently this year?
The real story is about what was happening one layer down, inside the apps themselves, where downloads and engagement don't always move in the same direction. That gap matters more for 2026 than the headline number does. In this article, we unpack the 2025 data and translate it into a testing plan for 2026.
Thanksgiving weekend 2025: A record-breaking run, powered by mobile
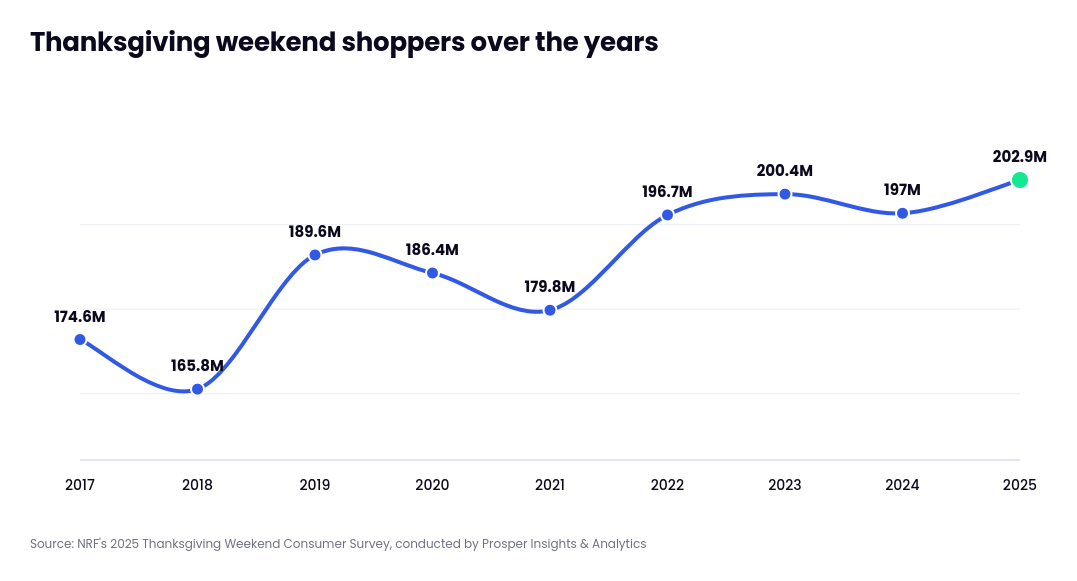
A record 202.9 million consumers shopped between Thanksgiving Day and Cyber Monday 2025, according to the National Retail Federation—up from 197 million in 2024 and past the previous high of 200.4 million set in 2023 [1].
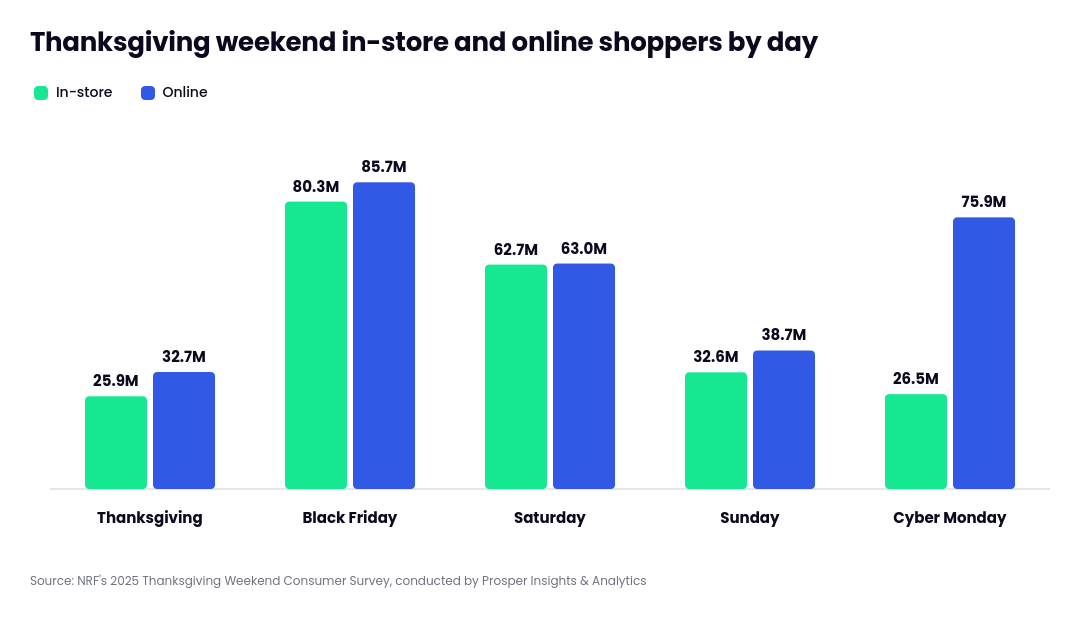
Split by channel, online growth outpaced in-store by a clear margin. In-store shopping grew a modest 3% year over year (126 million to 129.5 million), while online grew 9% (124.3 million to 134.9 million), making online the larger channel for the weekend. Black Friday remained the single biggest day for both, but the sharpest movement came later: Sunday in-store traffic jumped 27% year over year (25.6 million to a record 32.6 million), and Sunday online shopping climbed from 32.8 million to 38.7 million. Cyber Monday held its place as the second-biggest online day, at 75.9 million shoppers, up from 64.4 million [1].
Mobile did the heavy lifting within that online growth. For the second year running, mobile was the primary way people shopped online on Cyber Monday: 46.9 million consumers bought via mobile device that day, up from 40.4 million in 2024 [2]. And zooming out across the full holiday period, smartphones accounted for 56.4% of all US online transactions from November 1 through December 31, 2025, spiking to 61.6% on Thanksgiving Day itself and 66.5% on Christmas Day [2].
The state of mobile in Black Friday 2025: Downloads grew… what that growth actually meant is more complicated
According to Apptopia, downloads of retailer mobile apps grew 9.7% year over year over the Black Friday weekend, yet time spent per daily active user fell 18.2% [3]. So why, in a record-breaking year, were users spending less time in apps?
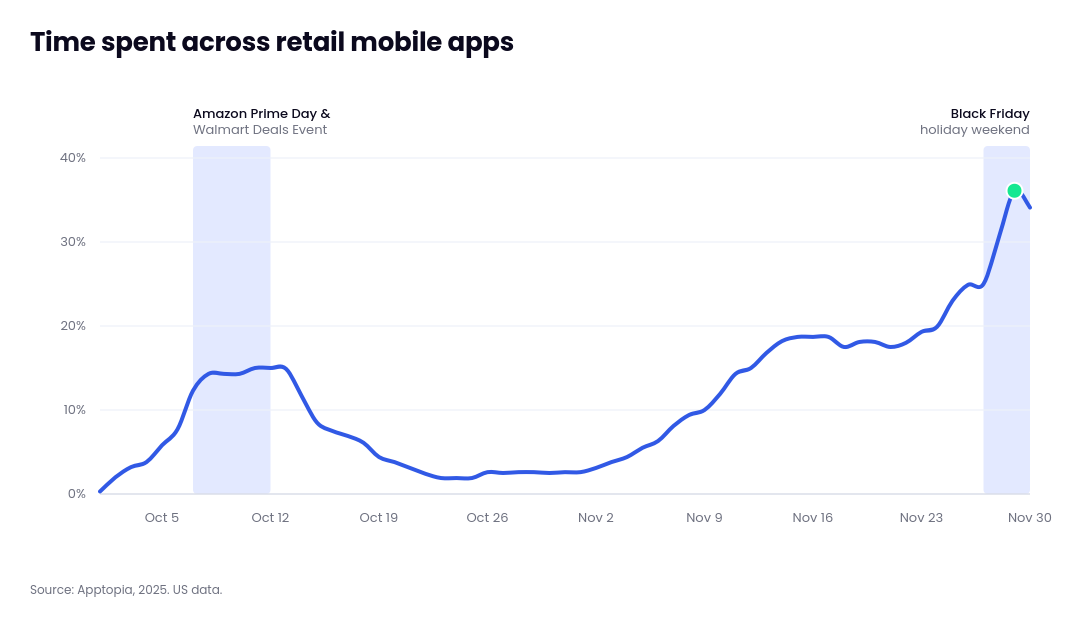
Shorter sessions aren’t necessarily a bad sign. In this case, shoppers are likely to have spent less time browsing and discovering inside these apps, and more time hunting for specific deals and installing the apps that offered them. That suggests a portion of the download growth is transactional rather than a sign of new, loyal shoppers.
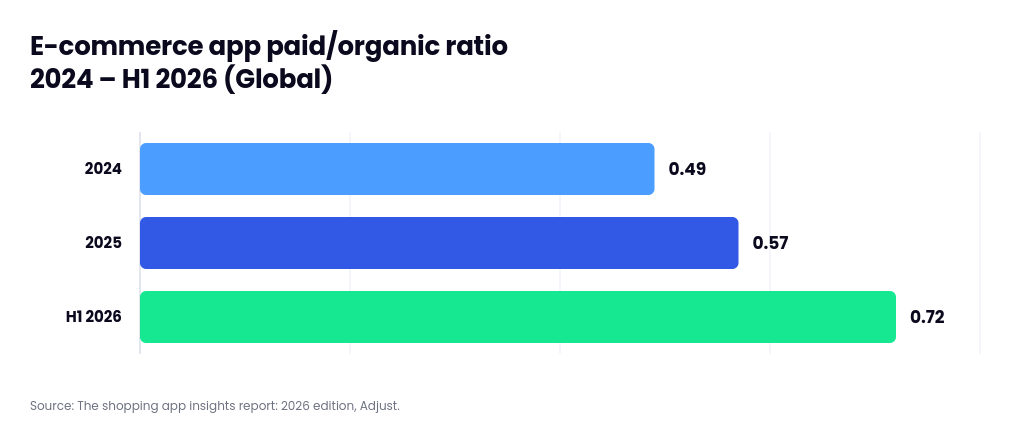
Adjust’s latest report helps explain why. The global paid/organic install ratio climbed 26% in H1 2026 alone, to 0.72, after already rising 16% in 2025 [4]. Marketers are leaning harder on paid acquisition to drive installs than they were even a year ago. The likelier read: apps are stickier at the category level than they were a few years ago, but growth on top of that baseline increasingly relies on paid strategies that attract the right shoppers.
What to watch out for in 2026
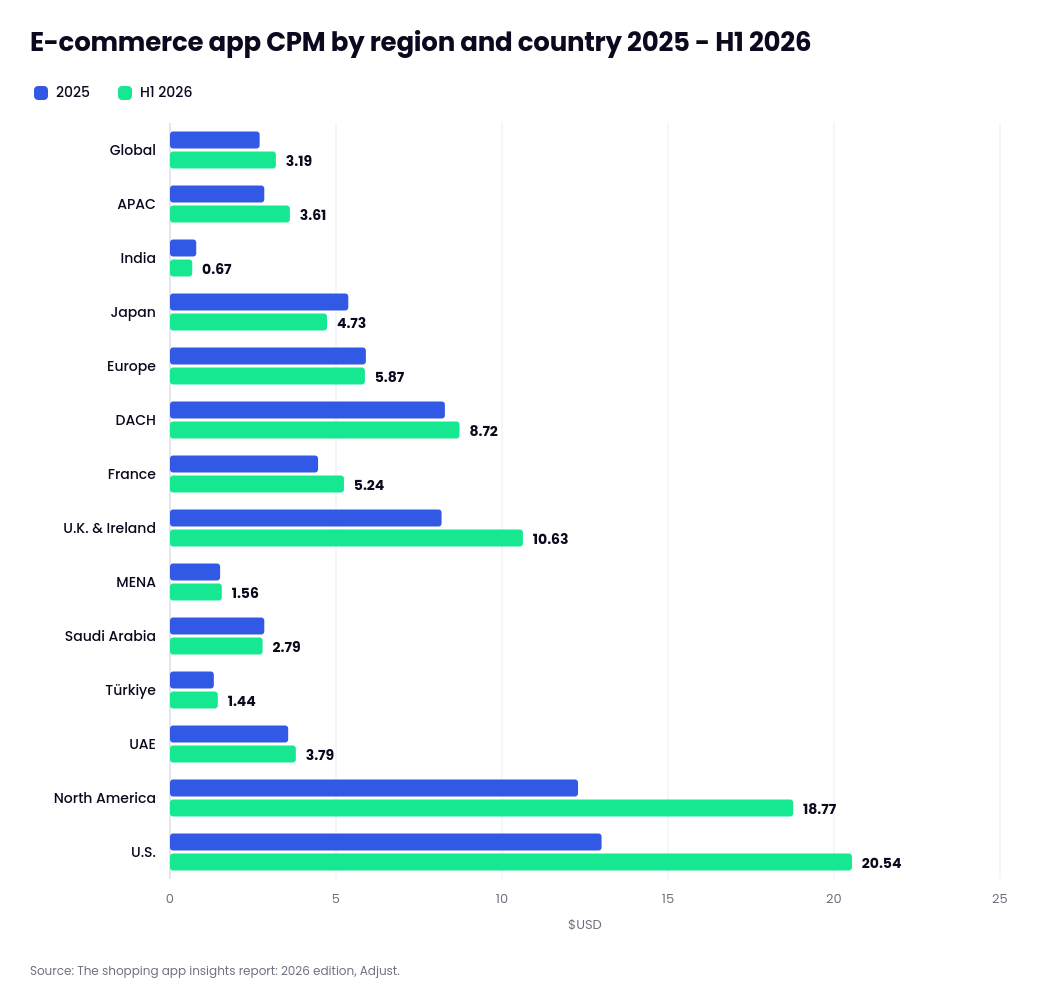
Costs are the first thing to keep an eye on, and the earlier you test, the less you pay to learn. CPM across e-commerce apps rose 32% between 2024 and H1 2026, from $2.42 to $3.19 globally. Versus 2025, North America saw the sharpest jump, with CPM climbing 53% to $18.77, and up to $20.54 in the US [4]. In markets this expensive, every impression spent figuring out which creative or audience works is costly, so it pays to run those tests before the season starts and enter it with proven winners.
Rising CPMs aren’t the whole picture, though. Global CPI stayed nearly flat at $1.08, and install-per-mille in North America rose 29%, which suggests better conversion is absorbing part of the increase. Even so, CPI in the U.S. rose 22% to $3.28, and in the U.K. & Ireland it jumped 80% to $3.85 [4]. These are the markets where competition for installs is most intense, and a late launch with an untested setup has the least room for error.
Three moves to make Black Friday mobile growth last in 2026
1. Pair User Acquisition with Activation
Installs are only the start. Pairing UA with Activation means the high-value shoppers you bring in come back and complete a registration or first purchase. That is how acquired users turn into the loyal shoppers the download numbers alone don’t show.
2. Start early, before prices climb
CPMs are rising worldwide and fastest in North America, where competition for installs is most intense. The cheapest time to learn is before the shopping season starts. Use the previous weeks to test creatives, audiences, and activation flows, so you enter Black Friday week scaling proven winners instead of paying peak prices to find them.
3. Track incrementality
If part of the download growth is deal-hunting, install volume alone can’t tell you which campaigns bring shoppers who wouldn’t have arrived anyway. Leverage Always-on Lift Measurement to track the incremental impact of your marketing efforts without pausing campaigns and without having to serve extra ads to a control group.
📚Recommended read: On-and-off lift tests vs always-on measurement: what each one costs.
Bonus: unlock a new channel with CTV performance
The shopping season is an ideal moment to extend your reach beyond mobile. CTV is worth testing as a performance channel aligned with the same goals as your mobile campaigns, with every install and in-app action tied to your CTV campaign measurable in real time through your MMP. At Jampp, we’ve developed CTV ad formats designed specifically for Shopping apps, helping brands make the most of every placement to showcase their products during Cyber Week, Black Friday, and every other key date on the retail calendar.
📚Recommended reads: How Fetch grew signups by 53% with Jampp CTV and CTV as the next performance engine, live at MAU Vegas.
Accelerate your app’s growth this shopping season
Ready to turn this season’s traffic into loyal shoppers? Talk to our team to build your UA, activation, and CTV plan before the season peaks.
References
[1] National Retail Federation (NRF), 2025.
[2] Adobe, 2025.
[3] Apptopia, 2025.
[4] Adjust, 2026.
Subscribe to our email newsletter



The programmatic platform to grow your app business


